Sentinel Kosten Berechnung - Warum das Sizing mittlerweile Rocket Science gleicht...
Ich beschäftige mich seit Jahren mit Microsoft Sentinel - als Lead Architect Security bei base-IT setze ich die Microsoft SIEM & SOAR Lösung regelmäßig bei Kunden ein. Und wenn ich eines gelernt habe, dann das: Die Kostenberechnung für Sentinel ist mittlerweile der komplexeste Part des gesamten Deployments.
Das klingt übertrieben? Ist es leider nicht. Wir reden hier nicht mehr von einem simplen GB × Preis-Modell (also ja - im Prinzip schon aber…). Wir reden von einem System mit ineinander verschachtelten Optimierungsebenen, bei dem ein falscher Dreh an der einen Stellschraube die andere invalidieren kann.
Ich kenne kaum jemanden, der seine Sentinel-Kosten wirklich bis ins Detail versteht. Die meisten nehmen den Pay-As-You-Go Preis und hoffen, dass es schon passen wird. Hier in diesem Artikel soll dieses “Geheimnis” gelöst werden. Falls Du trotz allem Hilfe benötigst, bitte zögere nicht weiter und melde dich bei mir.
Das Grundproblem: Zu viele Variablen
Wenn mich jemand fragt: “Was kostet uns Sentinel?”, ist meine ehrliche Antwort: Es kommt drauf an. Und zwar auf deutlich mehr Faktoren als man vermuten würde…
Die offensichtlichen Variablen
- Anzahl der User - bestimmt Sign-In Logs, Entra Audit Logs, Collaboration-Daten, Business Applikationen und vieles mehr
- Anzahl der Server - Windows Event Logs, Security Event Logs, Syslog, Performance Counter
- Netzwerkgeräte - Firewalls, Switches, Access Points, NAC
- DNS/DHCP-Infrastruktur - oft der volumenmäßig größte Log-Producer überhaupt aber trotz allem eine sehr interessante Log Source
- Proxy/SWG - Web-Traffic-Logs können schnell mehrere GB/Tag pro 1.000 User generieren und bieten vergleichsweise wenig Mehrwert
Die weniger offensichtlichen Variablen
- Lizenzierung - Ist M365 E5 oder E5 Defender Suite im Einsatz? Das aktiviert einen von vielen Microsoft Ingest Benefits.
- Microsoft Defender for Cloud - Ist Plan 2 für Server aktiv? Auch das hat direkte Auswirkungen auf die Ingestion-Kosten.
- Log-Verbosity - Ein Domain Controller produziert signifikant mehr Event Logs als ein Standard-Server.
- Non-Interactive Sign-Ins - Token Refreshes und Silent SSO machen typischerweise das 3-10-fache des interaktiven Sign-In-Volumens aus.
- Tageszeit - Ja, auch das spielt eine Rolle. Die Log-Verteilung über 24 Stunden ist nicht gleichmäßig und am Wochenende sieht’s natürlich nochmal anders aus
Die möglichen Ebenen der Kostenoptimierung
Was die Sache wirklich komplex macht: Es gibt nicht einen Preis. Es gibt mehrere Benefits und Optimierungsmöglichkeiten, die aufeinander aufbauen. Jede Stufe reduziert die Kosten - aber nur wenn man sie kennt und richtig einsetzt.
Schritt 1: Brutto-Volumen berechnen
Der erste Schritt ist noch vergleichsweise einfach: Man muss das tägliche Brutto-Ingestion-Volumen pro Kategorie schätzen. Also wieviel GB/Tag die einzelnen Quellen produzieren werden.
Klingt trivial, ist es aber nicht. Denn wer hat schon Ahnung, wieviel Daten die eigene Infrastruktur tatsächlich produziert. Und Microsofts eigene Schätzungen sind… optimistisch formuliert: selten akkurat (oder nicht existent).
Meine Erfahrungswerte aus diversen Projekten:
| Log-Kategorie | Typischer Treiber | Größenordnung |
|---|---|---|
| Sign-In Logs | pro User/Tag | 15-50 MB (interaktiv + non-interaktiv) |
| Control Plane (Entra Audit) | pro User/Tag | 3-8 MB |
| Windows Event Logs | pro Server/Tag | 200-500 MB (DC: 500-2000 MB) |
| Firewall | pro FW/Tag | stark variierend, 500 MB - 50 GB |
| DNS | pro DNS-Server/Tag | 1-20 GB |
| Proxy/SWG | pro 1.000 User/Tag | 2-10 GB |
DNS & DHCP-Logs sind der Klassiker: Kaum jemand rechnet damit, dass ein einzelner DNS/DHCP-Server mehrere GB pro Tag produzieren kann. Das sind oft die teuersten „Überraschungen” in der ersten Monatsrechnung. Gleiches gilt natürlich für Firewall Logs.
Schritt 2: Kostenlose Datenquellen abziehen
Was viele nicht wissen: Einige Datenquellen sind in Sentinel komplett kostenlos. Das steht zwar in der Microsoft Dokumentation, wird aber in Sizings erstaunlich oft vergessen.
Folgende Quellen kosten nichts:
- Azure Activity Logs (
AzureActivityTabelle) - sämtliche Control Plane Aktivitäten der Azure-Subscriptions - Office 365 Audit Logs (
OfficeActivityTabelle) - SharePoint, Exchange, Teams Aktivitäten - Security Alerts (
SecurityAlertTabelle) - Alerts aus Defender XDR, Defender for Cloud, Defender for Identity, MDE, MDCA, MDO
Das sind je nach Umgebung schnell 15-30% des Gesamtvolumens, die einfach wegfallen. Bei einem Kunden mit primär Cloud-Workloads und M365 kann das sogar noch mehr sein.
Schritt 3: Der M365 E5 Security Benefit
Und hier wird es richtig interessant. Kunden mit Microsoft 365 E5 oder E5 Defender Suite Add-on erhalten einen Data Grant von 5 MB pro User pro Tag für bestimmte Sentinel-Datenquellen.
Das klingt wenig - ist es aber nicht. Bei 1.000 Usern sind das 5 GB/Tag, die von folgenden Quellen abgezogen werden:
- Entra ID Sign-In und Audit Logs
- Microsoft Defender for Cloud Apps (MDCA)
- Microsoft Purview Information Protection
- M365 Advanced Hunting Daten (Defender XDR)
Bei einem Pay-As-You-Go Preis von €4,80/GB (EU West Region) sind das €24/Tag oder €720/Monat Ersparnis - nur durch den E5-Benefit. Bei 5.000 Usern reden wir von €3.600/Monat.
Schritt 4: Defender for Servers P2 Benefit
Wer Microsoft Defender for Cloud Plan 2 aktiviert hat, bekommt zusätzlich einen Ingestion Benefit von 500 MB pro Server pro Tag.
Dieser Benefit gilt für spezifische Security-Tabellen:
SecurityEvent/WindowsEventSecurityAlert/SecurityBaselineWindowsFirewall/ProtectionStatusUpdate/UpdateSummary
Wichtig: Das Upgrade von Defender for Cloud P1 auf P2 kostet ca. €10/Server/Monat. Ob sich das rechnet, hängt direkt davon ab, wieviel eligible Daten die Server tatsächlich produzieren.
Die Rechnung sieht vereinfacht so aus:
- Ein Windows Server produziert typischerweise 200-500 MB/Tag an eligible Events (DCs natürlich mehr)
- Der Benefit deckt 500 MB/Tag ab → das meiste ist abgedeckt
- Die Ersparnis bei €4,80/GB: ca. €1-2,40/Server/Tag = €30-72/Server/Monat
- Abzüglich der €10/Monat Upgradekosten: Netto €20-62/Server/Monat Ersparnis
Bei 50 Windows Servern kann das eine Ersparnis von €1.000-3.000/Monat bedeuten. Das ist signifikant.
Schritt 5: Auxiliary Logs / Data Lake Tier
Das ist - meiner Meinung nach - eins der besten Features, die Microsoft 2026 eingeführt hat und das Pricing-Modell nochmal deutlich komplexer gemacht hat.
Die Idee: Nicht alle Logs brauchen Real-Time Detection im Analytics Tier. Manche Log-Quellen haben ein extrem hohes Volumen, sind aber primär für Threat Hunting und Forensik relevant - nicht für Echtzeit-Alerting.
Für genau diese Daten gibt es den Data Lake Tier (früher “Auxiliary Logs”) mit einem drastisch reduzierten Preis von ca. €0,40/GB (die Kalkulation davon wäre nochmal einen eigenen Blogartikel wert…) statt €4,80/GB im Analytics Tier.
Typische Kandidaten für den Data Lake Tier:
| Log-Quelle | Warum Data Lake? |
|---|---|
| DNS/DHCP Logs | Extrem hohes Volumen, selten für Real-Time Detection benötigt |
| Proxy/SWG Logs | Summary/Block-Events in Analytics, der Rest in den Data Lake |
| Firewall Allow-Traffic | Deny/Threat-Logs in Analytics, Allow-Traffic in den Data Lake |
| NAC/Switch Logs | Auth-Failures in Analytics, Port-Events in den Data Lake |
| Non-Interactive Sign-Ins | Token Refreshes brauchen selten Real-Time Detection |
Der Trick dabei: Man teilt den Traffic einer Quelle auf - z.B. im Verhältnis 1:6 für DNS (1 Teil Analytics, 6 Teile Data Lake). Damit behält man die Detection-Fähigkeit für kritische Events, spart aber massiv bei den High-Volume-Daten.
Rechenbeispiel:
- Ein DNS-Server produziert 3 GB/Tag
- Alles im Analytics Tier: 3 × €4,80 = €14,40/Tag
- Split 1:6 → 0,5 GB Analytics + 3 GB Data Lake: (0,5 × €4,80) + (3 × €0,40) = €3,60/Tag
- Ersparnis: 75% für diese eine Quelle
Microsoft selbst empfiehlt den Data Lake Tier explizit für „lower fidelity or secondary security data” - siehe die offizielle Dokumentation.
Schritt 6: Commitment Tiers & Pre-Purchase Plans
Wer nach Schritt 1-5 sein tatsächliches Analytics-Tier-Volumen kennt, kann mit Commitment Tiers zusätzlich sparen. Statt Pay-As-You-Go bucht man ein festes Tagesvolumen und bekommt dafür einen Mengenrabatt.
Die Tiers starten bei 50 GB/Tag (Achtung - voraussichtlich nur mehr temporär verfügbar) und bieten je nach Volumen Rabatte bis über 50% gegenüber PAYG. Der Haken: Man zahlt das Commitment auch wenn man weniger verbraucht. Deshalb ist es kritisch, das Volumen nach den Optimierungsschritten 2-5 zu kennen, bevor man sich committet.
Zusätzlich gibt es seit 2024 Pre-Purchase Plans: Man kauft vorab Sentinel Commit Units (CUs) mit einem sehr guten Rabatt (abhängig von Azure Region - aber teilweise bis zu 20-30%) und verrechnet sie über 12 Monate. Diese CUs gelten allerdings nur für den Analytics Tier - Data Lake Tier wird hiermit nicht abgedeckt.
Warum ein Excel-Sheet nicht mehr reicht
Wenn man sich diese Möglichkeiten ansieht, wird klar: Die Berechnung ist ein mehrdimensionales Optimierungsproblem.
Die Schritte sind nicht unabhängig voneinander. Sowohl der E5-Benefit als auch der MDC P2-Benefit reduzieren das Volumen, das in den Data Lake verschoben werden kann. Die Logquellen, welche Sinn für den Ingest in das Data Lake Tier zu machen, zu identifizieren und wieviele Kosten dies verursachen würde, ist schwierig. Und das finale Analytics-Volumen bestimmt, welcher Commitment Tier und Pre-Purchase Plan sinnvoll ist.
Wenn man dann noch berücksichtigt, dass:
- Jede Log-Kategorie ihren eigenen Volumenfaktor hat
- Free Sources und der E5 Benefit nur bestimmte Tabellen betreffen
- MDC P2 nur Windows-basierte (keine Syslog) Events abdeckt
- Der Data Lake Split pro Quelle (und sogar noch granularer) konfigurierbar ist
- Commitment Tiers ein Minimum haben, das man auch bei Unterschreitung zahlt
…dann hat man ein System mit dutzenden voneinander abhängigen Variablen. Das ist mit einem einfachen Spreadsheet kaum noch sauber abbildbar - und schon gar nicht intuitiv für jemanden, der das zum ersten Mal macht.
Fazit: Es braucht ein besseres Tool
Die Realität ist: Die meisten Sizing-Gespräche, die ich führe, laufen nach dem gleichen Muster ab. Man schätzt grob, nimmt den PAYG-Preis, und wundert sich dann über die erste Rechnung. Oder man optimiert an einer Stelle, übersieht aber eine andere - und zahlt am Ende mehr als nötig.
Was fehlt, ist ein Tool, das alle diese Variablen zusammenbringt. Das die Abhängigkeiten versteht. Das zeigt, welche Optimierung sich bei genau dieser Umgebung lohnt und welche nicht. Und das die Ergebnisse so aufbereitet, dass man sie direkt in ein Angebot oder eine Architekturentscheidung übernehmen kann.
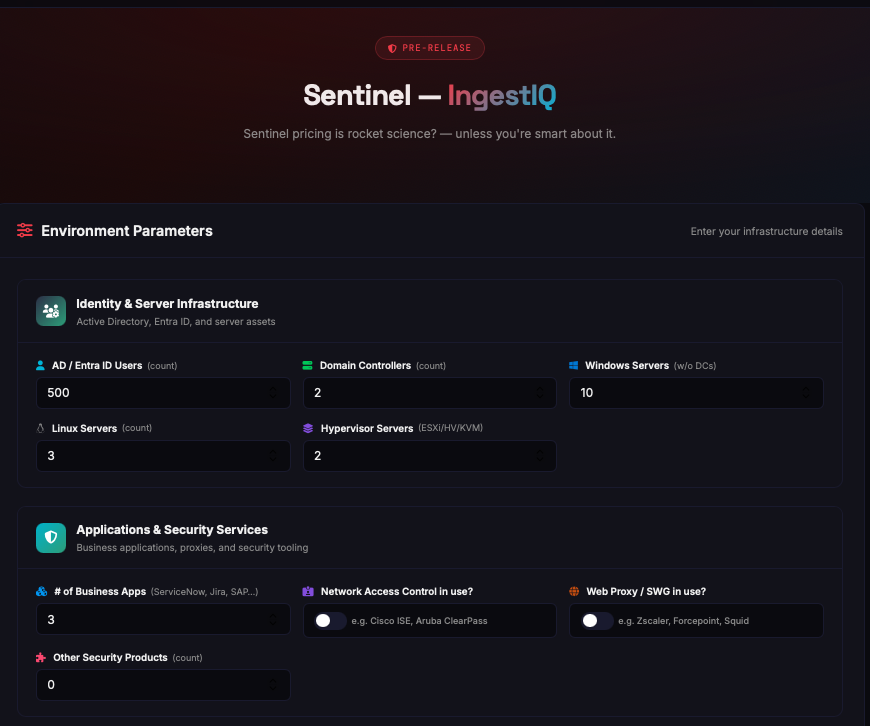
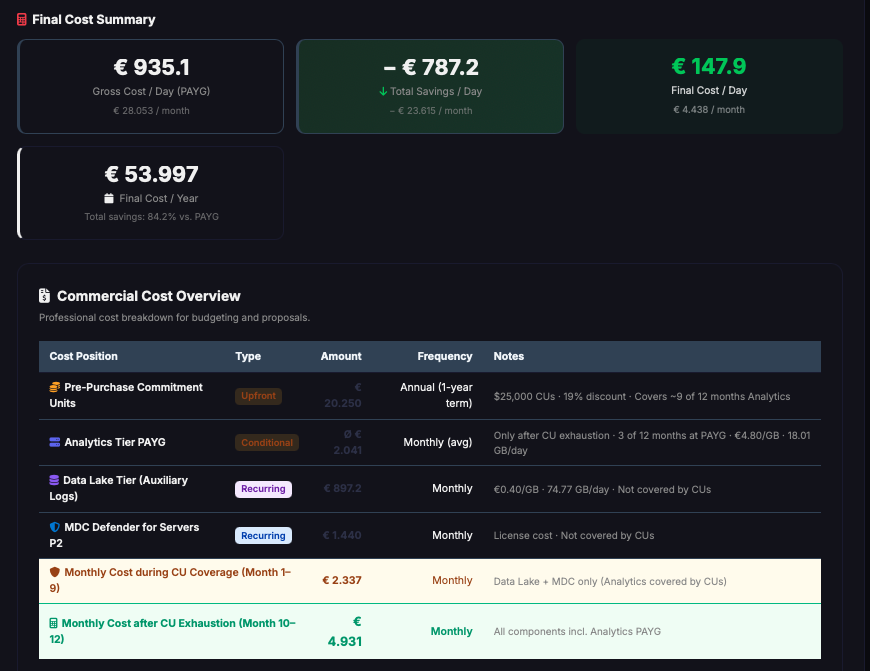
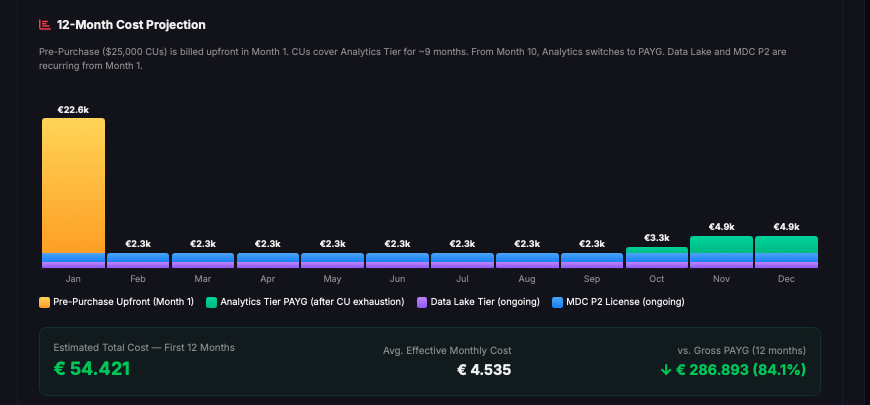
Sneak Peek: Genau an so einem Tool arbeite ich gerade. Ein Sentinel Ingest Calculator, der alle Benefits & Optimierungsmöglichkeitenabbildet - von der Brutto-Berechnung über Free Sources, E5, MDC P2 und Data Lake bis hin zu Commitment Tiers und Pre-Purchase Plans. Inklusive ROI-Berechnung für MDC P2, Waterfall-Visualisierung und PDF-Export eines “Commercial Proposals”.
Das Tool wird demnächst kostenfrei veröffentlicht - stay tuned. 🚀
Die wichtigsten Quellen zum Nachlesen
Für alle, die tiefer einsteigen wollen, hier die Microsoft-Dokumentation, die ich als essentiell erachte:
- Plan costs and understand Microsoft Sentinel pricing and billing - der Startpunkt für alles
- Reduce costs for Microsoft Sentinel - Commitment Tiers, Data Lake, Pre-Purchase
- Free data sources - welche Tabellen kostenlos sind
- Defender for Servers P2 Ingestion Benefit - der 500 MB/Server/Tag Benefit
- Switch to simplified pricing tiers - seit Juli 2023 das neue Unified Pricing
- Pre-Purchase Plans - CU-basierte Vorab-Rabatte
- Data tiers and retention - Analytics vs. Data Lake vs. Archive
Hast du Fragen zur Sentinel-Kostenberechnung oder zu den Optimierungsmöglichkeiten? Schreib mir auf LinkedIn oder per E-Mail.
I’ve been working with Microsoft Sentinel for years - as Lead Architect Security at base-IT, I regularly deploy the Microsoft SIEM & SOAR solution for customers. And if there’s one thing I’ve learned, it’s this: Cost calculation for Sentinel has become the most complex part of the entire deployment.
Sound like an exaggeration? Unfortunately, it isn’t. We’re no longer talking about a simple GB × price model (well, yes - in principle, but…). We’re talking about a system with interlinked optimization layers, where turning the wrong dial on one can invalidate another.
I barely know anyone who truly understands their Sentinel costs down to the detail. Most just take the Pay-As-You-Go price and hope for the best. This article aims to solve that “mystery.” If you still need help after reading this, don’t hesitate to reach out.
The Core Problem: Too Many Variables
When someone asks me: “What will Sentinel cost us?”, my honest answer is: It depends. On significantly more factors than you’d expect…
The Obvious Variables
- Number of users - drives Sign-In Logs, Entra Audit Logs, collaboration data, business applications, and much more
- Number of servers - Windows Event Logs, Security Event Logs, Syslog, performance counters
- Network devices - firewalls, switches, access points, NAC
- DNS/DHCP infrastructure - often the single largest log producer by volume, yet still a very interesting log source
- Proxy/SWG - web traffic logs can easily generate several GB/day per 1,000 users and offer comparatively little added value
The Less Obvious Variables
- Licensing - Does the organization have M365 E5 or E5 Defender Suite? That activates one of many Microsoft Ingest Benefits.
- Microsoft Defender for Cloud - Is Plan 2 for Servers active? That directly impacts ingestion costs.
- Log verbosity - A domain controller produces significantly more event logs than a standard server.
- Non-interactive sign-ins - Token refreshes and silent SSO typically generate 3-10× the volume of interactive sign-ins.
- Time of day - Yes, this matters too. Log distribution across 24 hours is not uniform, and weekends naturally look different again.
The Layers of Cost Optimization
What makes this truly complex: There isn’t one price. There are multiple benefits and optimization options that build upon each other. Each stage reduces costs - but only if you know about it and apply it correctly.
Step 1: Calculate Gross Volume
The first step is relatively straightforward: Estimate the daily gross ingestion volume per category. How many GB/day each source will produce.
Sounds trivial, but it isn’t. Because who actually knows how much data their own infrastructure produces? And Microsoft’s own estimates are… to put it kindly: rarely accurate (or non-existent).
My experience from various projects:
| Log Category | Typical Driver | Magnitude |
|---|---|---|
| Sign-In Logs | per user/day | 15-25 MB (interactive + non-interactive) |
| Control Plane (Entra Audit) | per user/day | 3-8 MB |
| Windows Event Logs | per server/day | 200-500 MB (DC: 500-2000 MB) |
| Firewall | per FW/day | highly variable, 500 MB - 50 GB |
| DNS | per DNS server/day | 1-20 GB (!) |
| Proxy/SWG | per 1,000 users/day | 2-10 GB |
DNS & DHCP logs are a classic: Hardly anyone expects a single DNS/DHCP server to produce several GB per day. These are often the most expensive “surprises” on the first monthly bill. The same applies to firewall logs, of course.
Step 2: Subtract Free Data Sources
What many don’t know: Some data sources are completely free in Sentinel. This is documented in the Microsoft documentation, but surprisingly often overlooked in sizing exercises.
The following sources cost nothing:
- Azure Activity Logs (
AzureActivitytable) - all control plane activities of Azure subscriptions - Office 365 Audit Logs (
OfficeActivitytable) - SharePoint, Exchange, Teams activities - Security Alerts (
SecurityAlerttable) - alerts from Defender XDR, Defender for Cloud, Defender for Identity, MDE, MDCA, MDO
Depending on the environment, that’s easily 15-30% of total volume that simply drops off. For customers with primarily cloud workloads and M365, it can be even more.
Step 3: The M365 E5 Security Benefit
This is where it gets really interesting. Customers with Microsoft 365 E5 or E5 Defender Suite Add-on receive a Data Grant of 5 MB per user per day for specific Sentinel data sources.
That sounds small - but it isn’t. For 1,000 users, that’s 5 GB/day deducted from:
- Entra ID Sign-In and Audit Logs
- Microsoft Defender for Cloud Apps (MDCA)
- Microsoft Purview Information Protection
- M365 Advanced Hunting data (Defender XDR)
At a Pay-As-You-Go price of €4.80/GB (EU West region), that’s €24/day or €720/month in savings - just from the E5 benefit. For 5,000 users, we’re talking €3,600/month.
Step 4: Defender for Servers P2 Benefit
Those with Microsoft Defender for Cloud Plan 2 active get an additional ingestion benefit of 500 MB per server per day.
This benefit applies to specific security tables:
SecurityEvent/WindowsEventSecurityAlert/SecurityBaselineWindowsFirewall/ProtectionStatusUpdate/UpdateSummary
Important: The upgrade from Defender for Cloud P1 to P2 costs approximately €10/server/month. Whether that pays off depends directly on how much eligible data the servers actually produce.
The math simplified:
- A Windows server typically produces 200-500 MB/day of eligible events (DCs naturally more)
- The benefit covers 500 MB/day → most of it is covered
- Savings at €4.80/GB: approximately €1-2.40/server/day = €30-72/server/month
- Minus the €10/month upgrade cost: Net €20-62/server/month savings
With 50 Windows servers, that can mean savings of €1,000-3,000/month. That’s significant.
Step 5: Auxiliary Logs / Data Lake Tier
This is - in my opinion - one of the best features Microsoft introduced in 2026, making the pricing model considerably more complex yet again.
The idea: Not all logs need real-time detection in the Analytics Tier. Some log sources have extremely high volume but are primarily relevant for threat hunting and forensics - not real-time alerting.
For exactly these data, there’s the Data Lake Tier (formerly “Auxiliary Logs”) with a drastically reduced price of approximately €0.40/GB (the calculation behind that would warrant its own blog article…) instead of €4.80/GB in the Analytics Tier.
Typical candidates for the Data Lake Tier:
| Log Source | Why Data Lake? |
|---|---|
| DNS/DHCP Logs | Extremely high volume, rarely needed for real-time detection |
| Proxy/SWG Logs | Summary/block events in Analytics, the rest in the Data Lake |
| Firewall allow traffic | Deny/threat logs in Analytics, allow traffic in the Data Lake |
| NAC/Switch Logs | Auth failures in Analytics, port events in the Data Lake |
| Non-interactive sign-ins | Token refreshes rarely need real-time detection |
The trick: You split a source’s traffic - e.g., at a 1:6 ratio for DNS (1 part Analytics, 6 parts Data Lake). This preserves detection capability for critical events while massively saving on high-volume data.
Example calculation:
- A DNS server produces 3 GB/day
- All in Analytics Tier: 3 × €4.80 = €14.40/day
- Split 1:6 → 0.5 GB Analytics + 3 GB Data Lake: (0.5 × €4.80) + (3 × €0.40) = €3.60/day
- Savings: 75% for this one source
Microsoft themselves explicitly recommend the Data Lake Tier for “lower fidelity or secondary security data” - see the official documentation.
Step 6: Commitment Tiers & Pre-Purchase Plans
Once you know your actual Analytics Tier volume after steps 1-5, you can save even more with Commitment Tiers. Instead of Pay-As-You-Go, you book a fixed daily volume and receive a volume discount.
Tiers start at 50 GB/day (note - likely only temporarily available) and offer discounts of up to 50%+ compared to PAYG depending on volume. The catch: You pay the commitment even if you consume less. That’s why it’s critical to know the volume after optimization steps 2-5 before committing.
Additionally, since 2024 there are Pre-Purchase Plans: You buy Sentinel Commit Units (CUs) upfront with a very attractive discount (depending on Azure region - but potentially up to 20-30%) and apply them over 12 months. These CUs only apply to the Analytics Tier - the Data Lake Tier is not covered.
Why a Spreadsheet Won’t Cut It Anymore
Looking at these options, it becomes clear: The calculation is a multi-dimensional optimization problem.
The steps aren’t independent. Both the E5 benefit and the MDC P2 benefit reduce the volume that can be shifted to the Data Lake. Identifying which log sources make sense for Data Lake Tier ingestion and how much that would cost is difficult. And the final Analytics volume determines which Commitment Tier and Pre-Purchase Plan makes sense.
When you additionally consider that:
- Each log category has its own volume factor
- Free sources and the E5 benefit only affect specific tables
- MDC P2 only covers Windows-based (no Syslog) events
- The Data Lake split is configurable per source (and even more granularly)
- Commitment Tiers have a minimum you pay even if you’re under
…you have a system with dozens of interdependent variables. That’s nearly impossible to model cleanly in a simple spreadsheet - and certainly not intuitive for someone doing it for the first time.
Conclusion: We Need a Better Tool
The reality is: Most sizing conversations I have follow the same pattern. You estimate roughly, take the PAYG price, and then wonder about the first bill. Or you optimize in one area, miss another - and end up paying more than necessary.
What’s missing is a tool that brings all these variables together. That understands the dependencies. That shows which optimization pays off for this specific environment and which doesn’t. And that presents the results in a way you can directly use in a proposal or architecture decision.
Sneak Peek: I’m currently working on exactly such a tool. A Sentinel Ingest Calculator that covers all benefits & optimization options - from gross calculation through free sources, E5, MDC P2, and Data Lake all the way to Commitment Tiers and Pre-Purchase Plans. Including ROI calculation for MDC P2, waterfall visualization, and PDF export of a “Commercial Proposal.”
The tool will be released for free soon - stay tuned. 🚀
Essential Documentation
For those wanting to dive deeper, here’s the Microsoft documentation I consider essential:
- Plan costs and understand Microsoft Sentinel pricing and billing - the starting point for everything
- Reduce costs for Microsoft Sentinel - Commitment Tiers, Data Lake, Pre-Purchase
- Free data sources - which tables are free
- Defender for Servers P2 Ingestion Benefit - the 500 MB/server/day benefit
- Switch to simplified pricing tiers - the unified pricing since July 2023
- Pre-Purchase Plans - CU-based upfront discounts
- Data tiers and retention - Analytics vs. Data Lake vs. Archive
Have questions about Sentinel cost calculation or optimization options? Reach out on LinkedIn or via email.